Our approach
At Camino, AI is a tool, not a replacement for the creativity and expertise our team brings to every project. This brief was no exception. You wanted pub extenders produced faster with AI, but without compromising on quality, creativity or impact for your field teams and HCP audience. By combining smart use of technology with our team’s experience and judgement, that’s exactly what we set out to deliver.
Step 1 · Prompting for initial creation
The prompt
“Build a single-page, MLR-safe infographic from the peer-reviewed HELIOS-B GI poster. Lead with the conclusion; tell the story in order. Neutral, observational language only. Alnylam blue, no downward arrows. Adjusted rate ratios with 95% CI and an n for every figure. Frame it as exploratory and keep the self-reported limitation visible.”
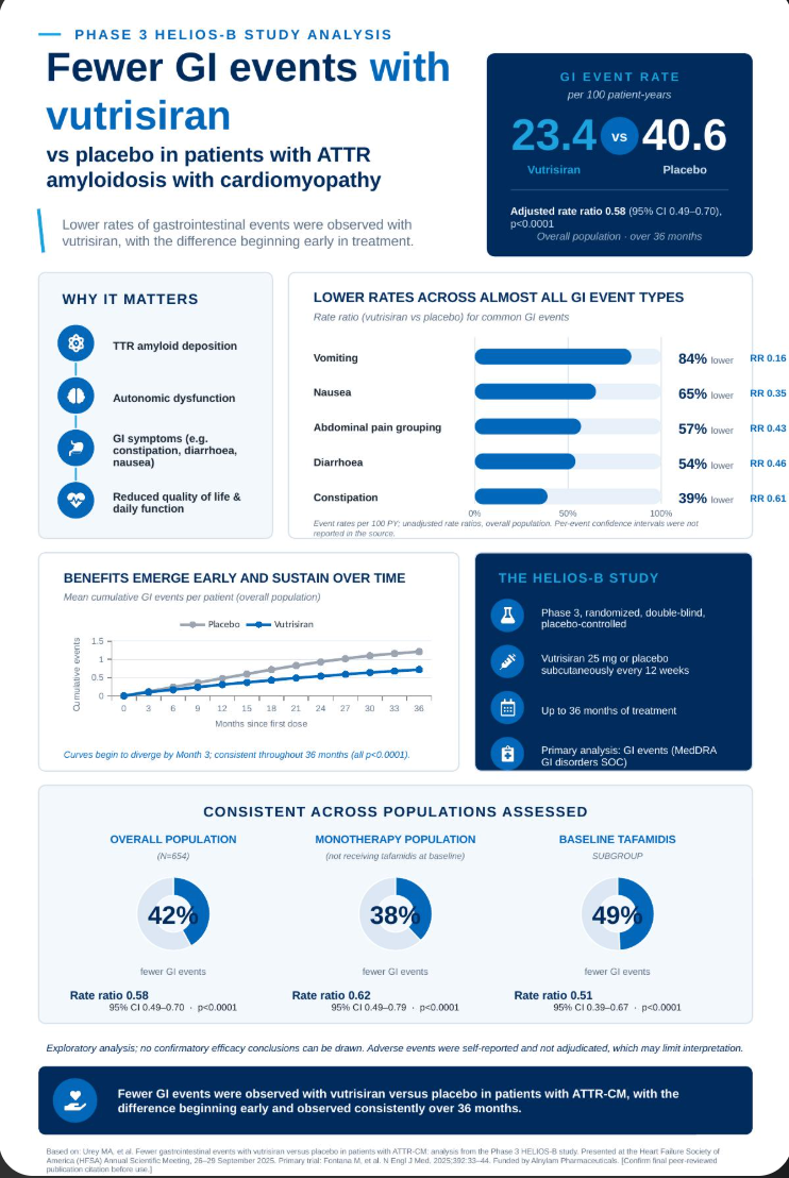
The output
A strong, on-brand starting point to review and refine.
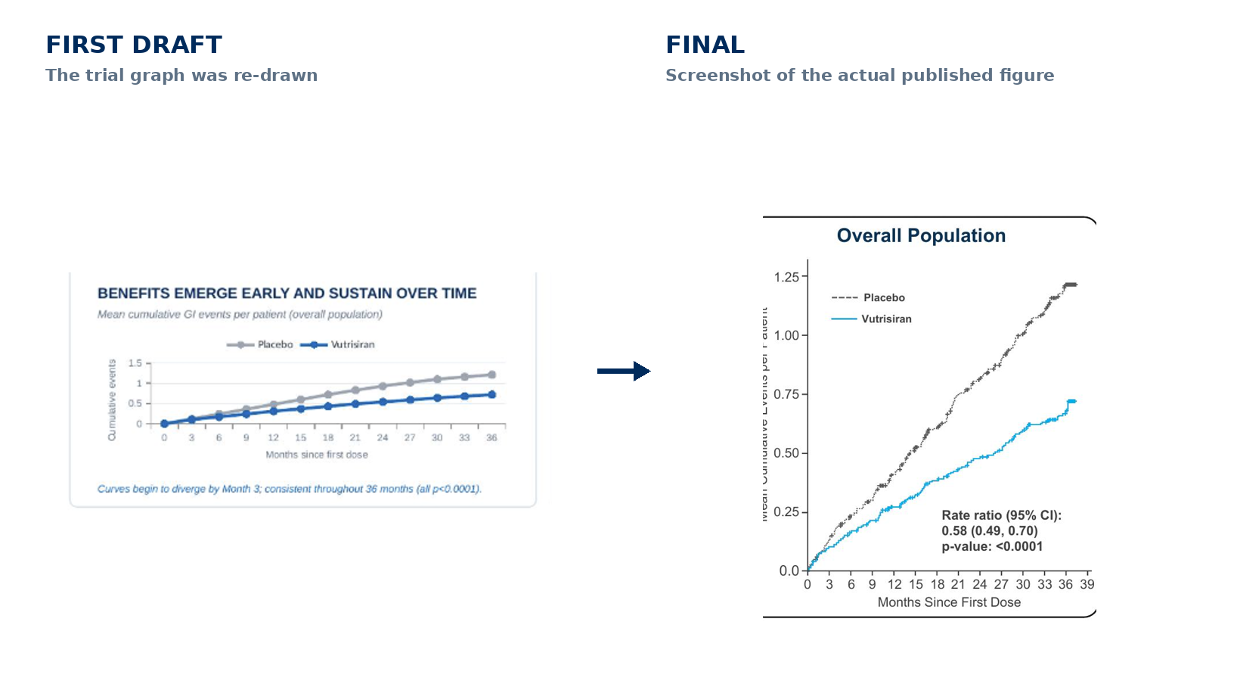
Accuracy: use the source figure
The first draft re-drew the trial’s graph; for total fidelity, we replaced it with a screenshot of the actual published figure, so the curve is the trial’s own, not an approximation.
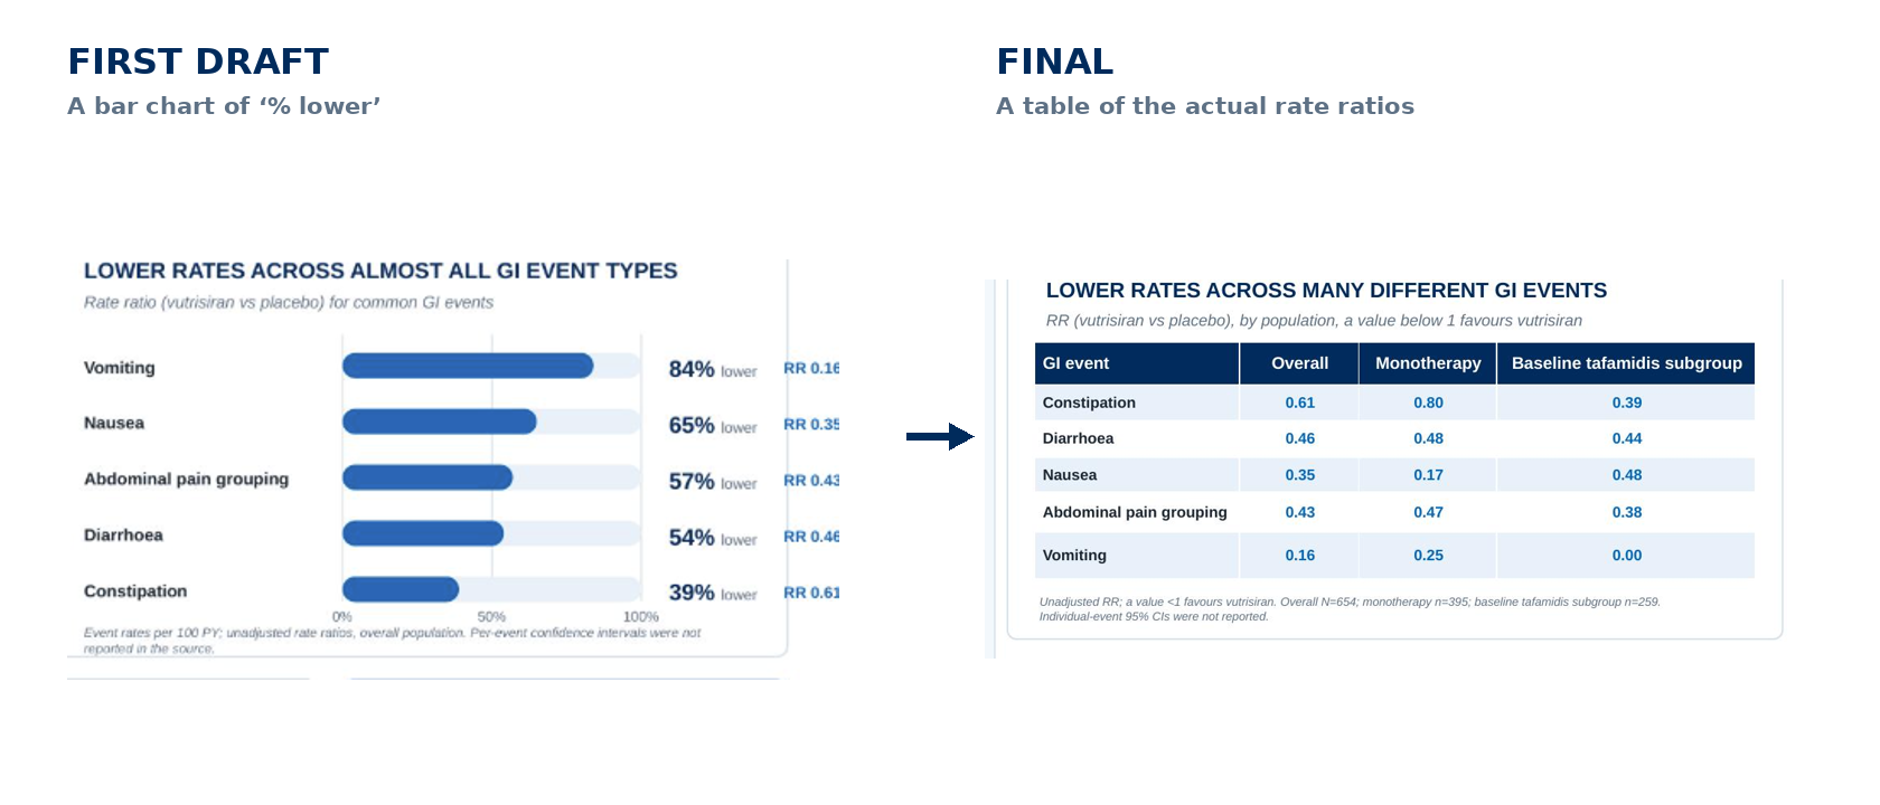
Accuracy: rate ratios, not proportions
The bar chart’s ‘% lower’ bars implied proportions of patients the analysis never measured. It was replaced with a plot of the actual rate ratios against the no-difference line, so the figure states only what the source reported.
Step 2 · Building the data pack
The prompt
“Build a verified data pack. Extract every figure (rates, rate ratios, 95% CIs and n) and map each to its exact place in the source. Separate adjusted from unadjusted rate ratios. Flag where individual-event CIs are not reported. List every abbreviation. Annotate the source behind each claim.”
What it produced
- Every figure traced to its exact place in the poster
- Adjusted vs unadjusted rate ratios separated and labelled
- Missing individual-event 95% CIs flagged
- A complete abbreviation list
- An annotated source behind every claim
Step 3 · Line-by-line editorial check
The prompt
“Run a line-by-line editorial and MLR check on the client-ready file. Verify every figure against the source. Keep the language neutral, with no implied efficacy. Ensure ‘nominal’ precedes every p-value and the p is italicised. Check every abbreviation is defined and alphabetical, with an n beside every percentage. Return a findings list.”
What it caught
- A p-value missing its ‘nominal’ label
- A p that was not italicised
- Abbreviations to add, and unused ones to remove
- A misspelled drug name
- ‘either … and’ where the source reads ‘or’
Further shaped through human review
- The draft was then shaped further through a senior scientific review that challenged the data visualisation
- Review amends were taken in, and language was reworded to ensure the piece stayed neutral with no implied efficacy
- The visual hierarchy was refined so the piece reads as a clear story, making the study’s key takeaways easy to understand
Initial design ideas
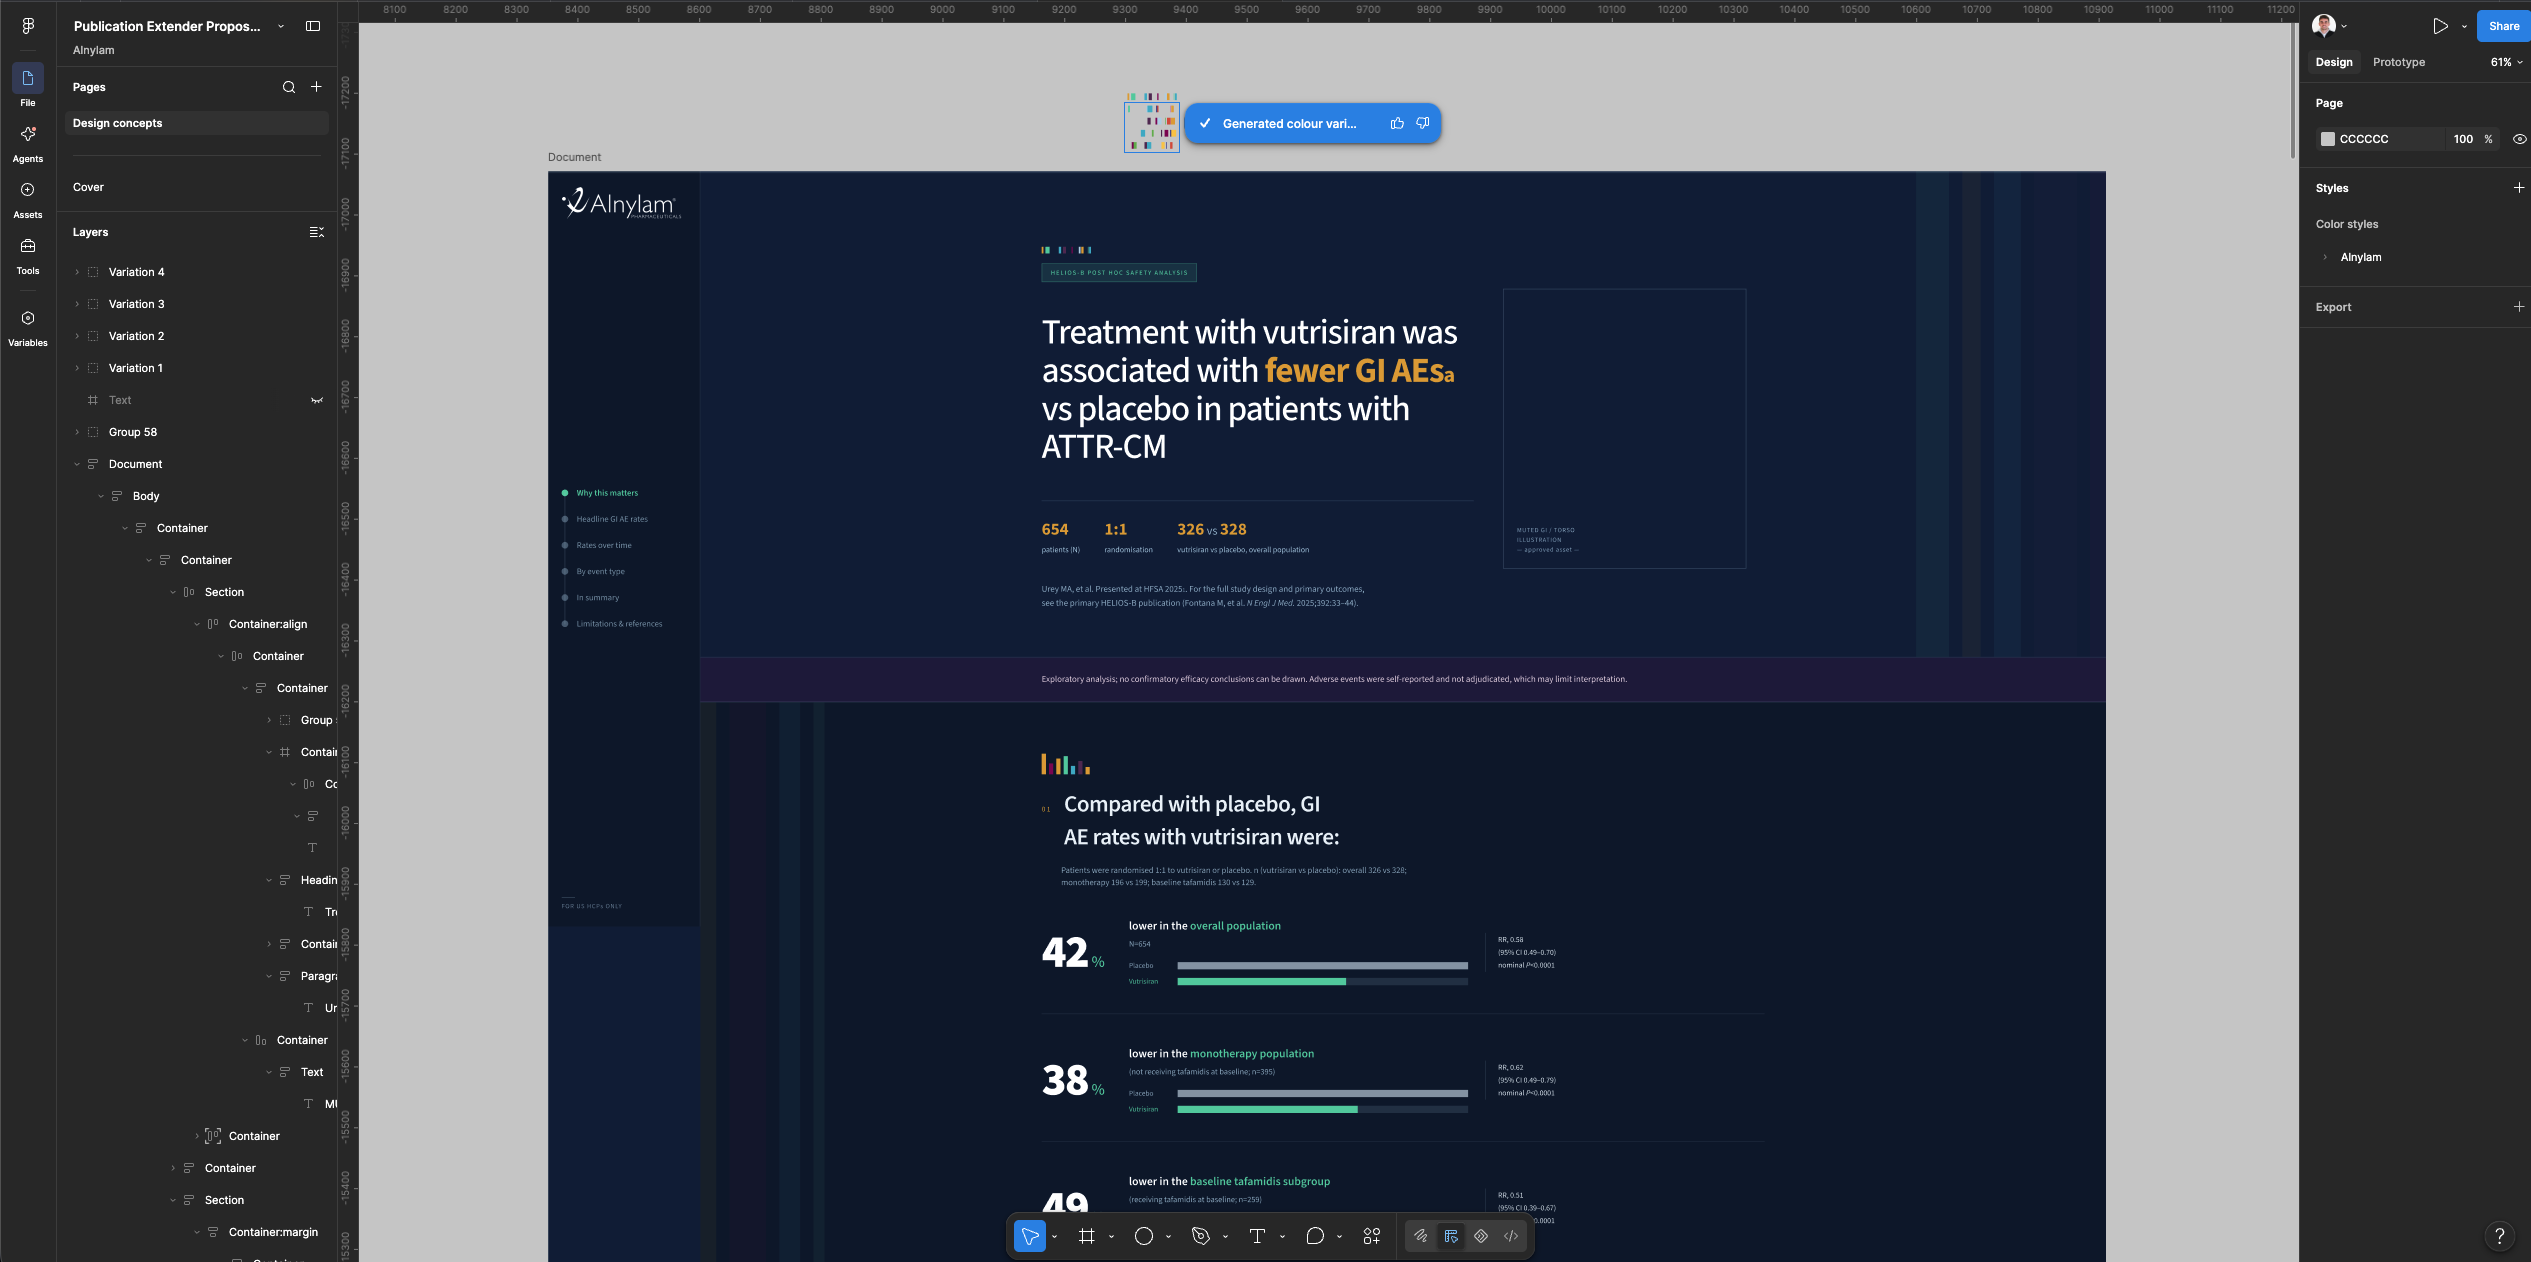
The design actually started using Claude Design, inputting the original content document to generate some different ideas for layouts. The made the initial layouts more efficient and made something that could be tweaked further in other programs.
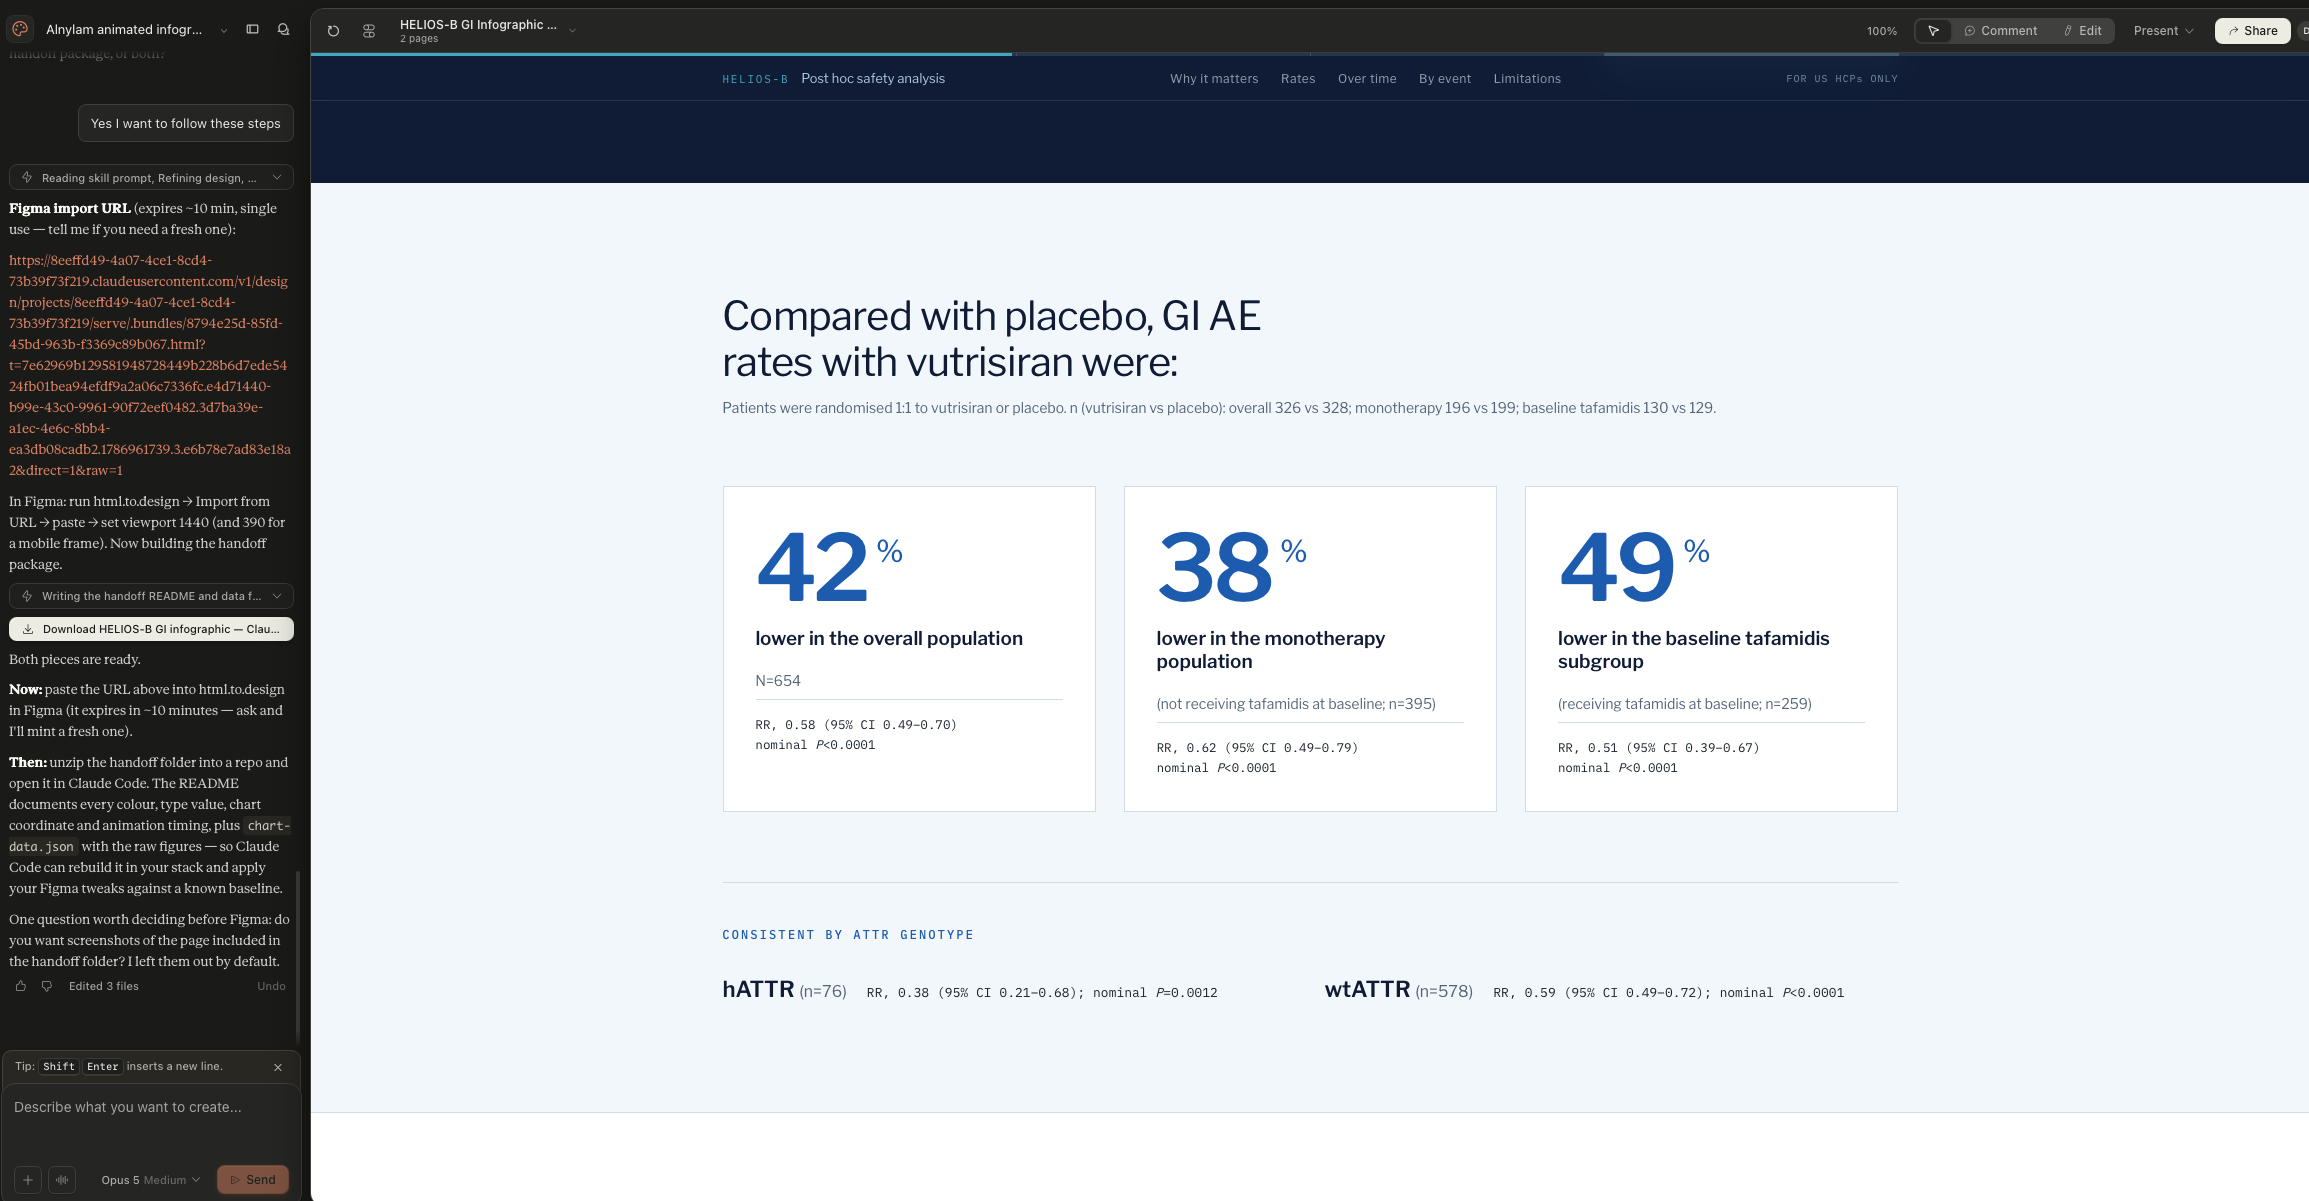
Refining the design
We could then export the design from Claude and refine it in Figma, giving us control over the finer details and letting us strip out the creative assumptions AI tends to make.
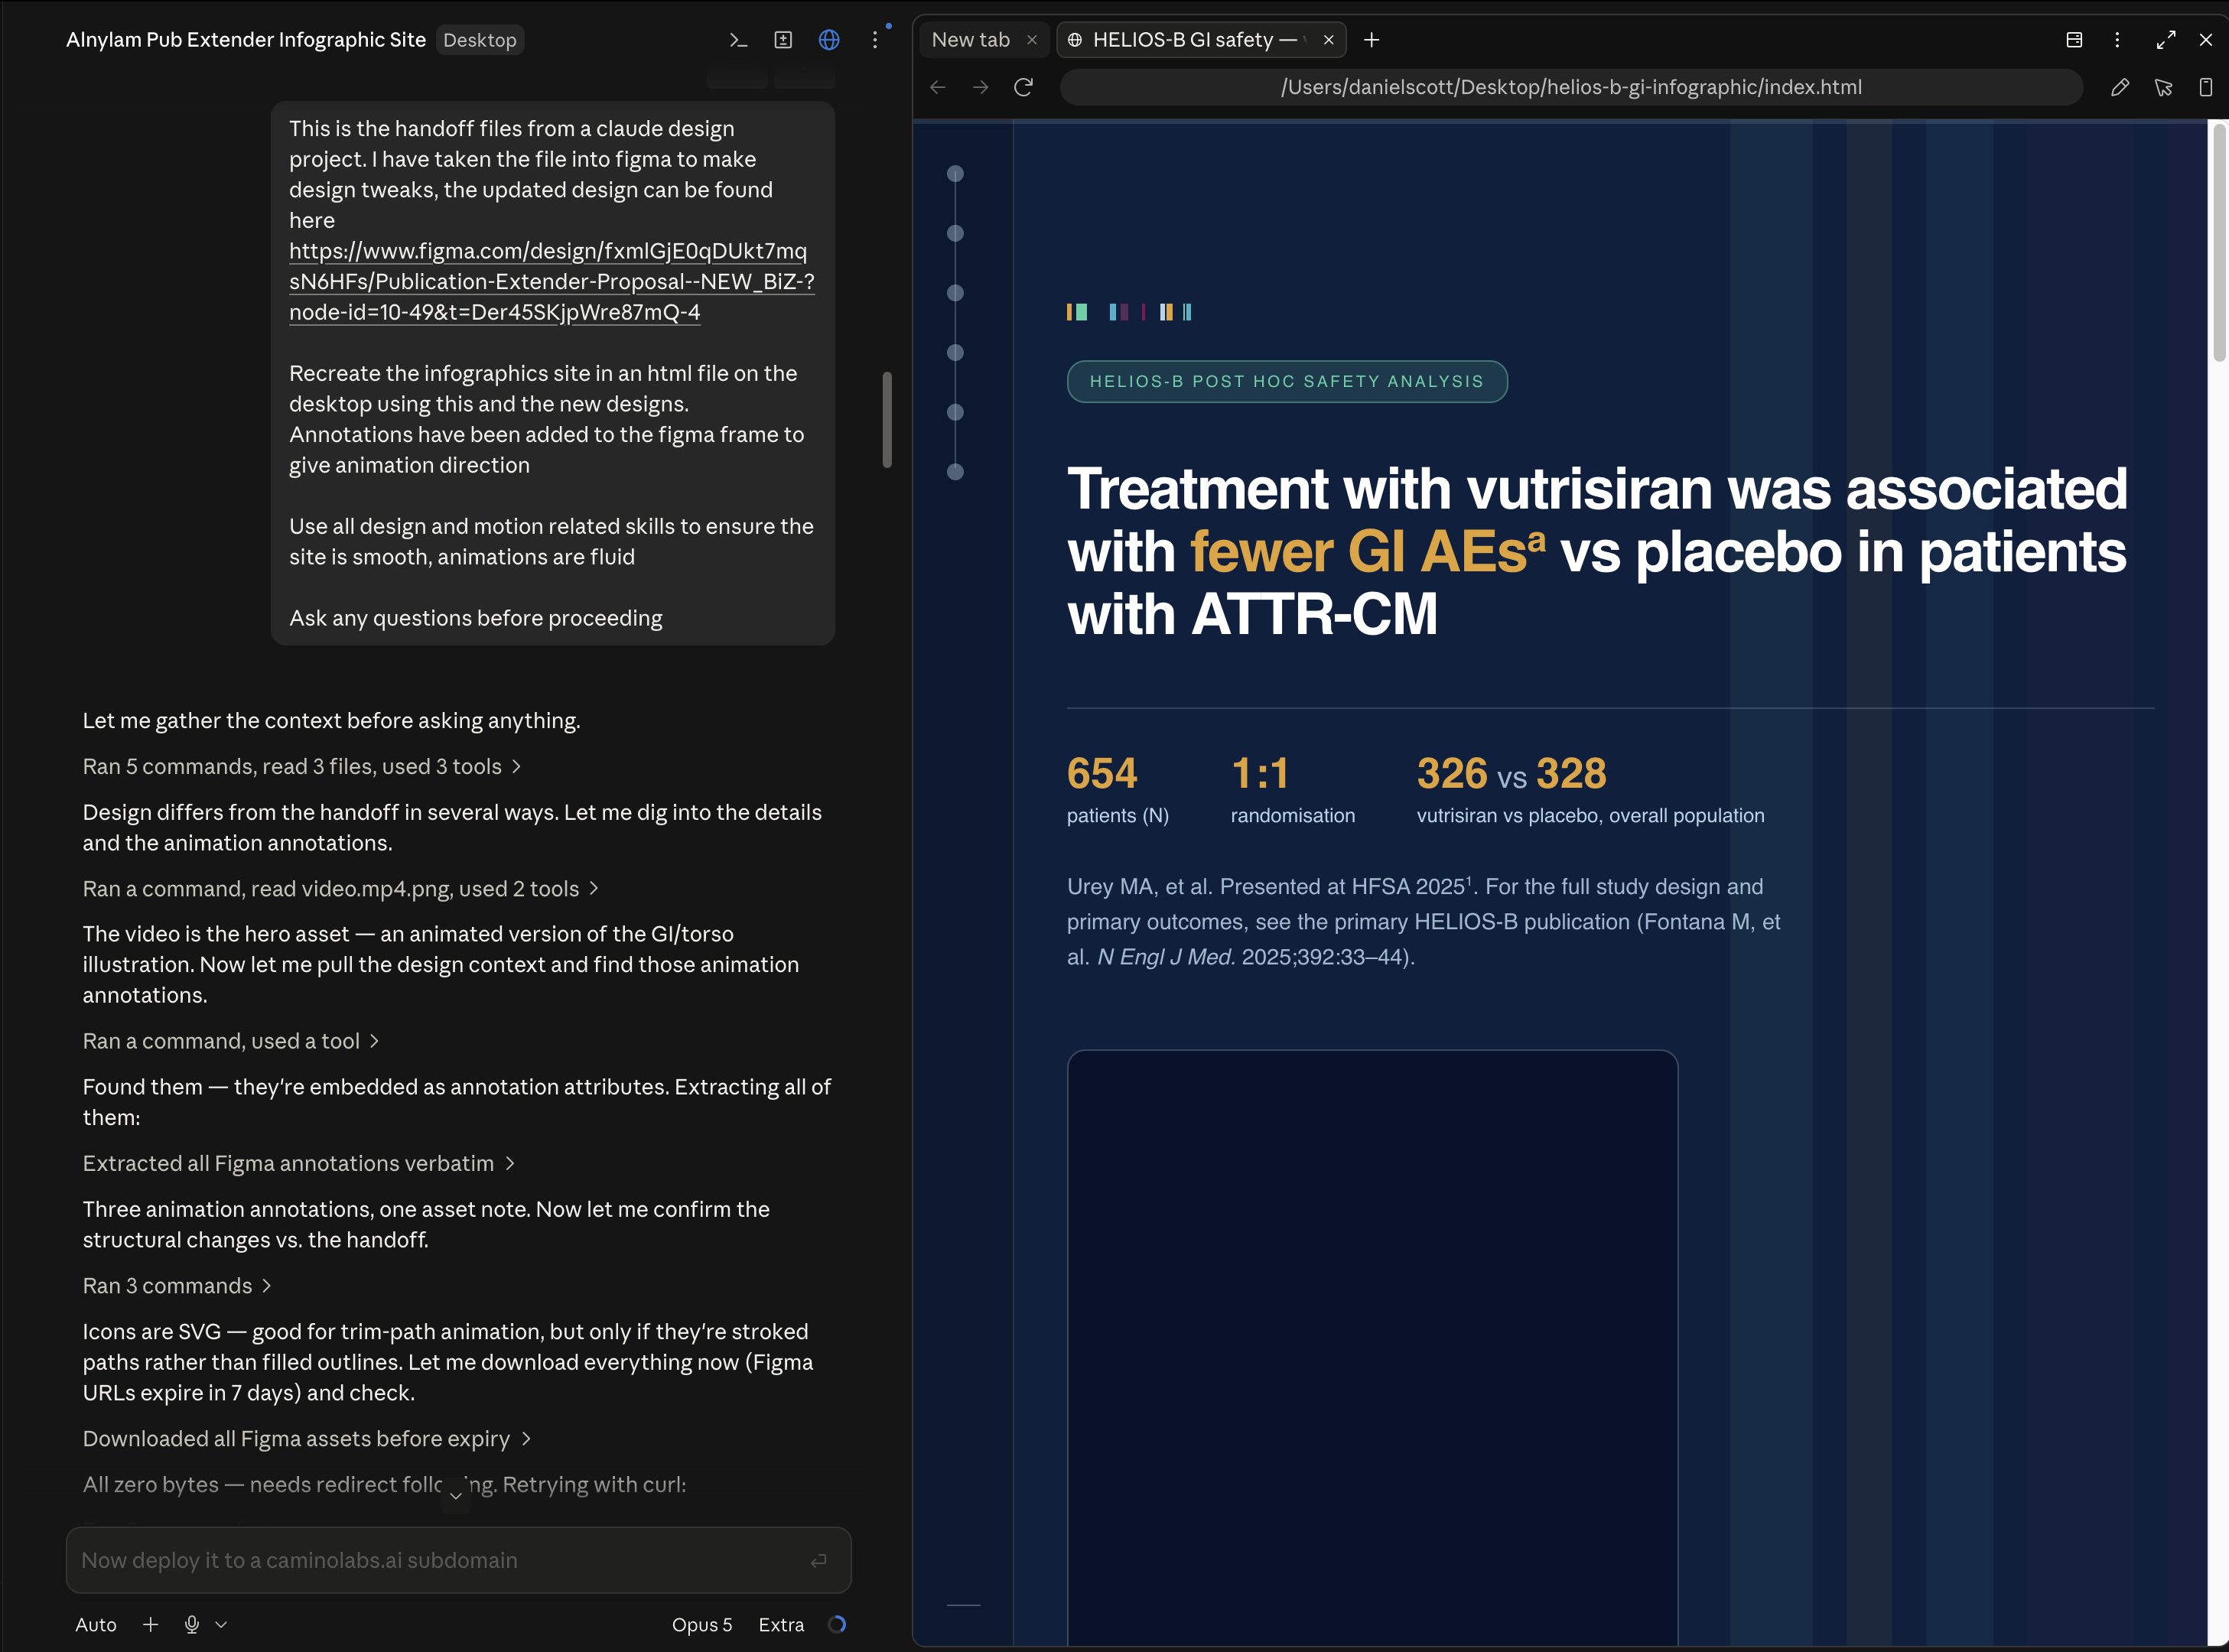
Building the site
The Figma designs were then fed back into Claude Code to build the live, responsive version. Several iterations followed, refining the placement of individual elements and the animations between them.
3D modelling
To create the interactive hero model, an illustrated human anatomy image was created in ChatGPT, and then refined to ensure the background and transparency settings could be integrated into the site design.
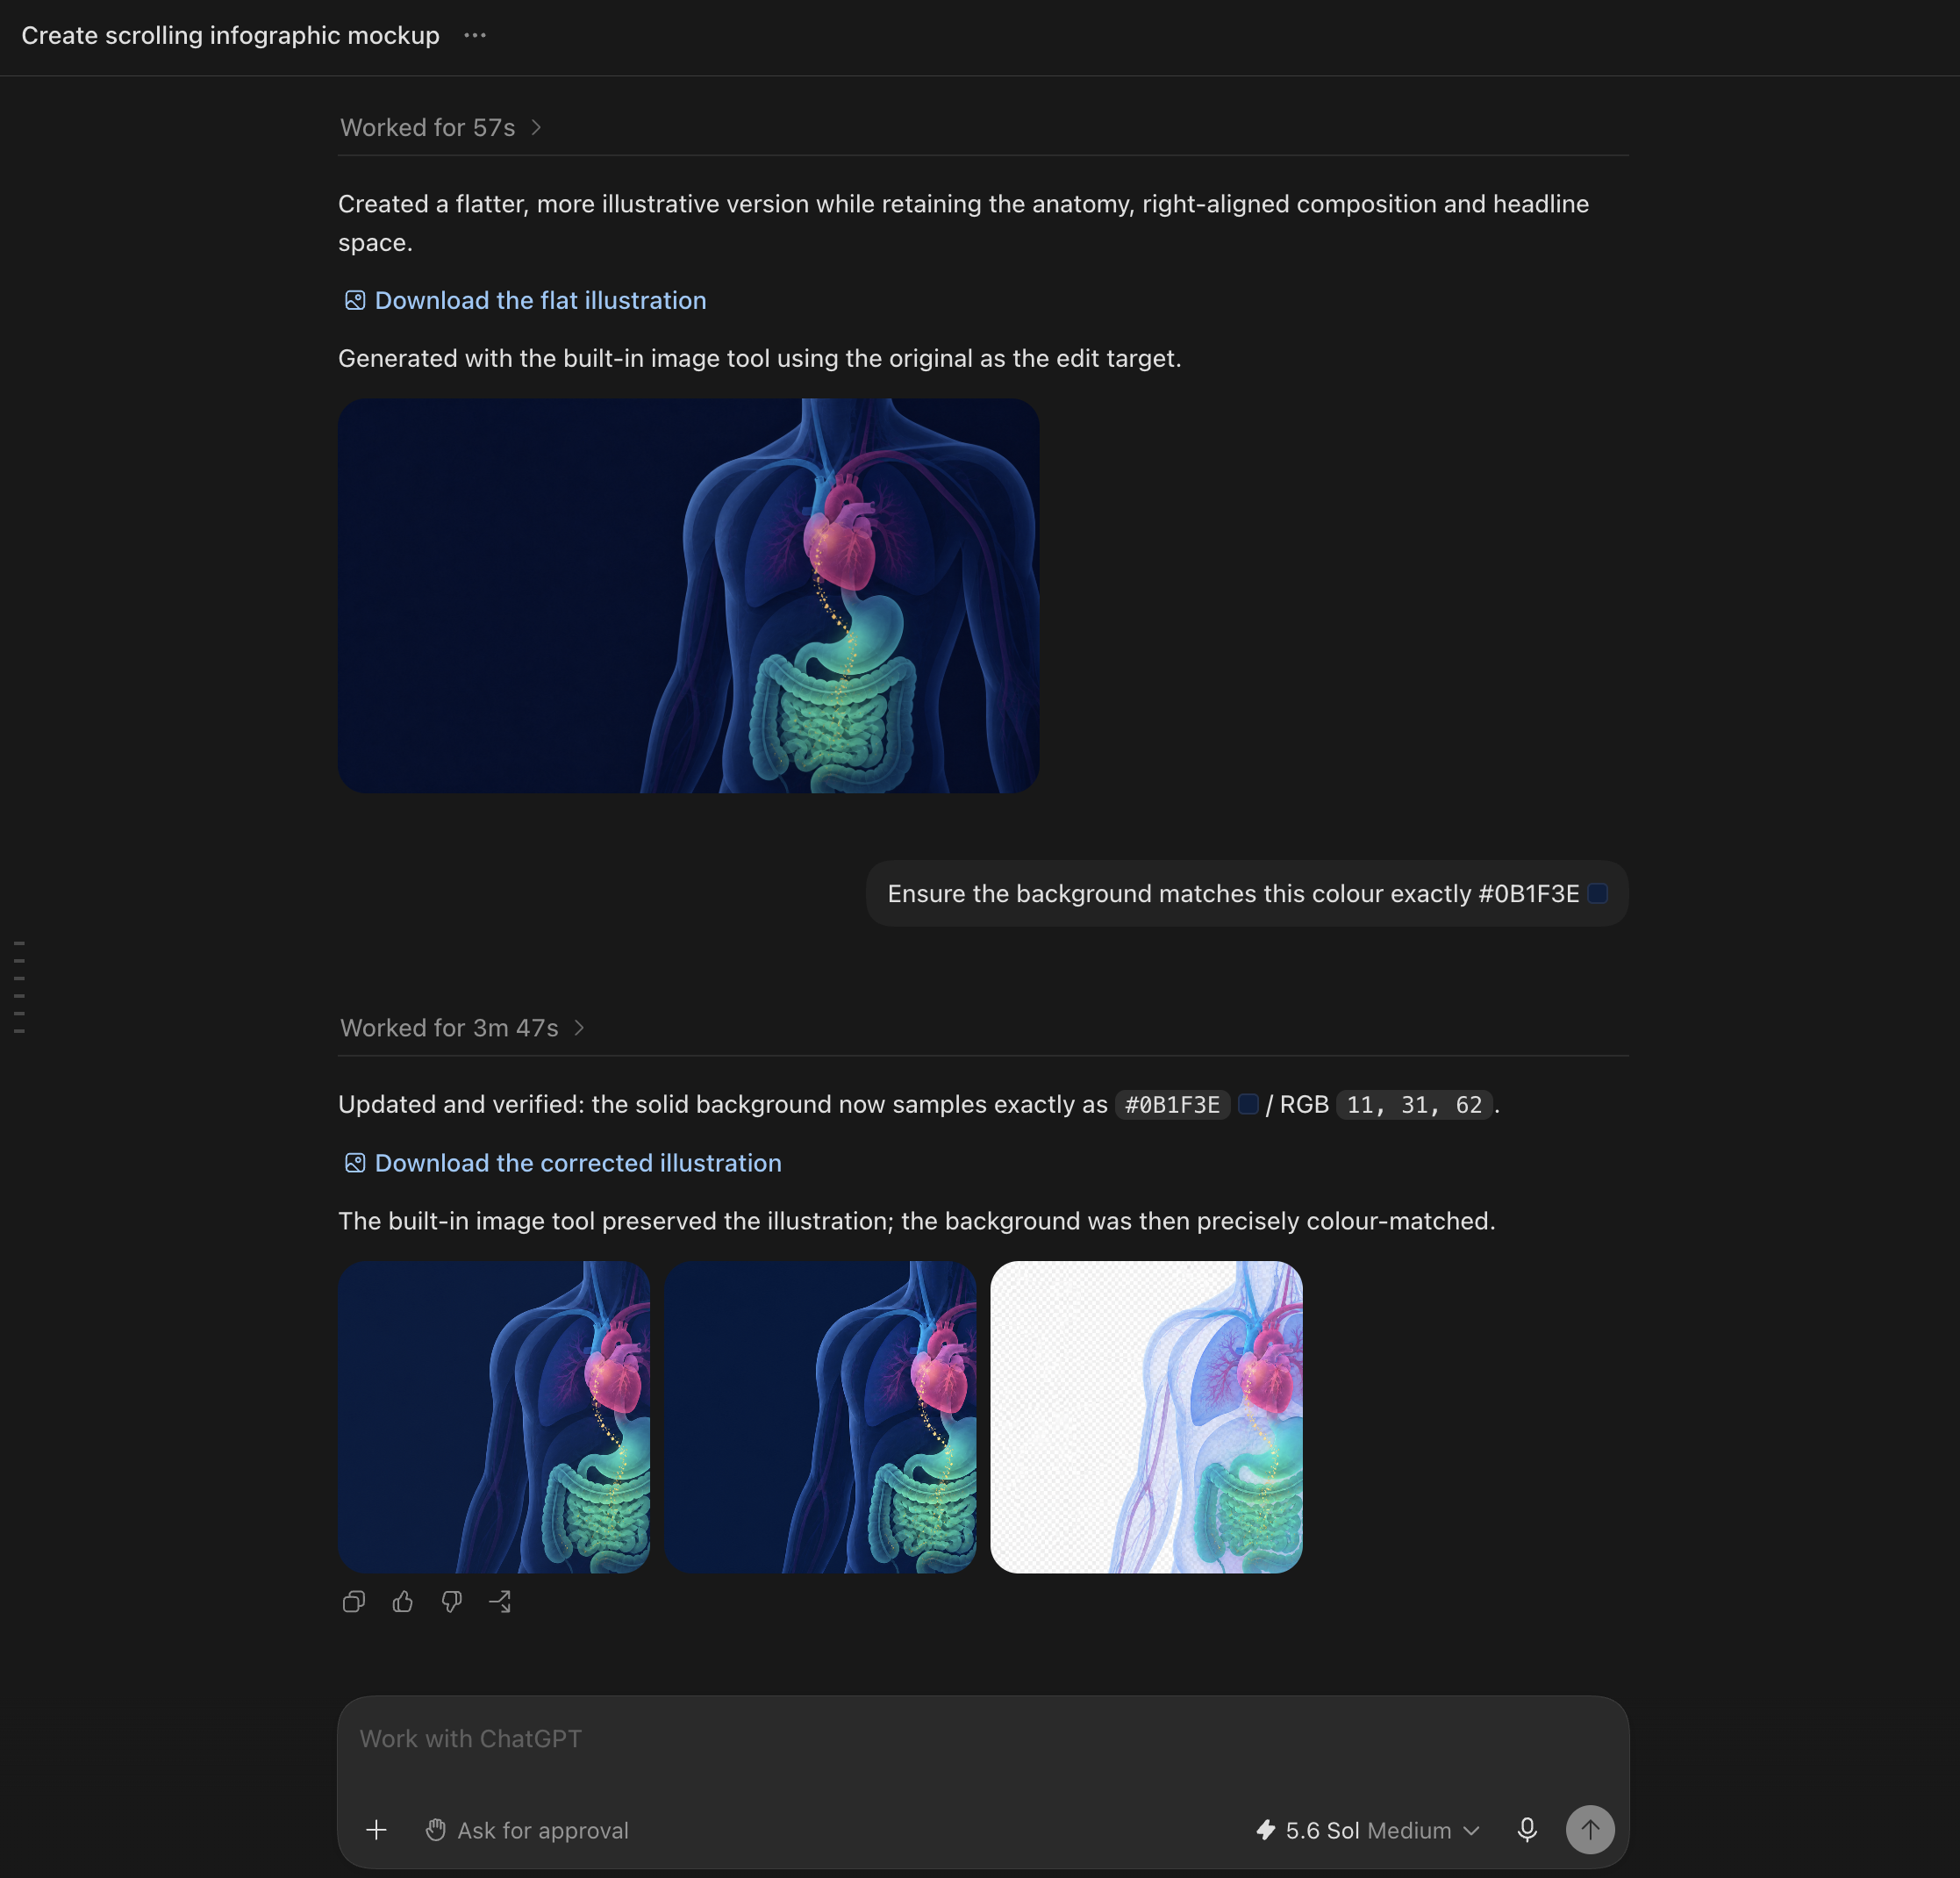
Using various plugins and connectors a 3D mesh object was created that could then be added to the website, scaled correctly and mouse interactions developed.
AI and people,
together
Sped up by AI
- First-draft copy and layout variants to react to, not start from scratch
- Verifying every figure against source, at speed
- Turning Figma designs into a live, interactive build
- Generating the anatomical illustrations, later refined into interactive 3D elements
Delivered by us
- Scientific judgement and content accuracy
- Checking every claim, figure and abbreviation against source, line by line
- Refining the design and code by hand, stripping out AI’s creative guesswork
- Shaping the story so the takeaway lands clearly, not just correctly
AI gave us pace, our team gave it judgement
How much would it cost?
AI handles the heavy lifting so we can spend budget where it counts: accuracy, compliance and craft
The estimate costs are
- Interactive HTML build (custom illustration, 3D/interactive elements): £10–20k
- Static PDF version: £5–10k
Final price depends on
- Complexity of the source pub
- Number of review/MLR rounds
- Level of custom illustration or interactivity